Kansas City Chiefs vs Philadelphia Eagles Match Player Stats: Eagles Rout the Three-Peat Bid
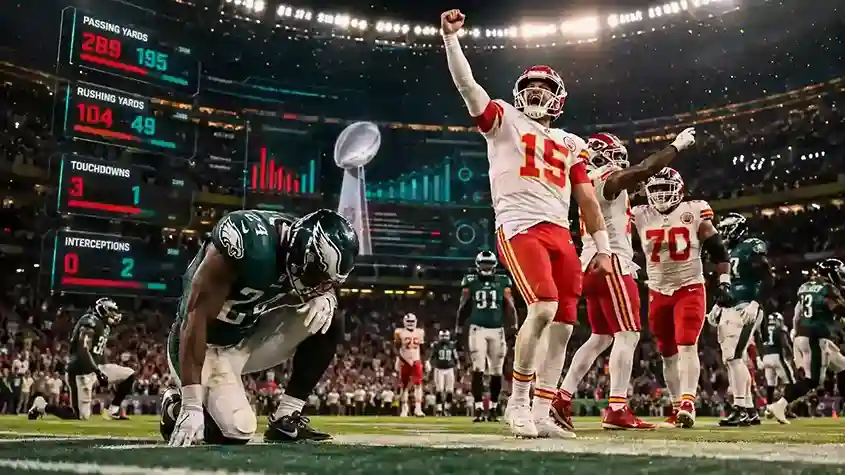
Three-peats don’t happen by accident, and neither do 24-0 halftime deficits. If you’re hunting for the full Kansas City Chiefs vs Philadelphia Eagles match player stats, the short version is this: Philadelphia’s defensive front and a pick-six buried Kansas City before the second quarter even ended. Below is every number that mattered, broken down player by player, quarter by quarter.
The Lead
Super Bowl LIX kicked off on February 9, 2025, at Caesars Superdome in New Orleans, Louisiana, in front of 65,719 fans. The Philadelphia Eagles entered as NFC champions looking to avenge a three-point loss in Super Bowl LVII, while the Kansas City Chiefs arrived at 15-2 chasing a first-ever Super Bowl three-peat. None of that history mattered once the ball was kicked off — Philadelphia jumped ahead early and never let go, closing out a 40-22 win.
The game was effectively decided by halftime. Philadelphia scored on four of its first five drives, including a Cooper DeJean pick-six off Patrick Mahomes, and took a 24-0 lead into the locker room. Jalen Hurts was named Super Bowl MVP after accounting for three total touchdowns, while Kansas City’s offense didn’t cross midfield until the third quarter was already more than halfway gone.
Match Overview Table
| Information | Match Details |
| Event | Super Bowl LIX (2024 NFL Season) |
| Game | Kansas City Chiefs vs Philadelphia Eagles |
| Date | February 9, 2025 |
| Venue | Caesars Superdome, New Orleans, LA |
| Attendance | 65,719 |
| Winner | Philadelphia Eagles |
| Final Score | Eagles 40, Chiefs 22 |
| Broadcast | FOX, Tubi, Fox Deportes, Telemundo |
Core Match Statistics Overview
Team Stats Table
| Metric | Kansas City Chiefs | Philadelphia Eagles |
| Total Yards | 275 | 345 |
| Total Plays | 49 | 70 |
| Yards Per Play | 5.6 | 4.9 |
| Passing Yards | 226 | 210 |
| Yards Per Pass Attempt | 7.1 | 9.1 |
| Rushing Yards | 49 | 135 |
| Yards Per Rush | 4.5 | 3.0 |
| First Downs | 12 | 21 |
| Third Down Conversions | 3/11 | 3/12 |
| Red Zone Efficiency | 1/1 | 2/3 |
| Turnovers | 3 | 1 |
| Penalties | 7-75 | 8-59 |
| Time of Possession | 23:02 | 36:58 |
Time of Possession and Tempo Control
- Philadelphia held the ball for nearly 37 minutes, almost 14 more than Kansas City managed.
- That possession gap let the Eagles’ front seven stay fresh and pin their ears back on every Chiefs dropback.
Turnover Margin
- Kansas City coughed up the ball three times against a single Eagles giveaway, and one of those turnovers went back for a touchdown.
- This game demonstrated that a -2 turnover margin in a Super Bowl is practically a death sentence.
Third Down Efficiency
- Both teams converted exactly three of their third-down tries, but Philadelphia’s longer drives meant those conversions came with the game already in hand.
- Kansas City’s third-down struggles kept its offense off rhythm for most of the first half.
Yards Per Play Discrepancy
- Kansas City actually posted a better yards-per-play average (5.6 to 4.9), a stat that looks strange next to a 40-22 final score.
- The explanation is snap count: Philadelphia ran 70 plays to Kansas City’s 49, grinding out extra possessions and extra scoring chances.
Period-by-Period Analysis
| Quarter | Chiefs | Eagles |
| 1st | 0 | 7 |
| 2nd | 0 | 17 |
| 3rd | 6 | 10 |
| 4th | 16 | 6 |
| Total | 22 | 40 |
- First quarter: Philadelphia opened the scoring on a Jalen Hurts 1-yard touchdown run, capping a 7-play, 69-yard drive and setting the tone for the rest of the half.
- Jake Elliott’s field goal, Cooper DeJean’s 38-yard pick-six off Mahomes, and a 12-yard Hurts-to-A.J. Brown touchdown pass turned a manageable deficit into a 24-0 blowout by the break.
- Third and fourth quarters: Philadelphia tacked on a field goal and a DeVonta Smith touchdown catch to push the lead to 34-0 before Kansas City finally got on the board; the Chiefs’ late push, including an Xavier Worthy touchdown, only closed the final margin, not the outcome.
Kansas City Chiefs Player Statistics
Patrick Mahomes (QB): 21-of-32 passing for 257 yards with 2 touchdowns and 3 interceptions. Mahomes never found a rhythm behind a beaten-up offensive line, and the turnovers erased whatever ground his arm talent gained.
Xavier Worthy (WR): 8 receptions for 157 yards and 2 touchdowns. Worthy was Kansas City’s only consistent explosive threat and finished as the Chiefs’ clear statistical leader on the day.
Travis Kelce (TE): 4 receptions for 39 yards. Kelce didn’t record his first catch until deep into the third quarter, a sign of how completely Philadelphia’s coverage took away Kansas City’s usual short-to-intermediate rhythm passing.
DeAndre Hopkins (WR): 2 receptions for 18 yards and a touchdown. Hopkins’ score came as part of Kansas City’s fourth-quarter comeback attempt that arrived far too late.
Philadelphia Eagles Player Statistics
Jalen Hurts (QB): 17-of-22 passing for 221 yards, 2 passing touchdowns and 1 interception, plus 11 carries for 72 rushing yards and a rushing touchdown. Hurts was efficient through the air and physical on the ground, and his all-around production earned him Super Bowl MVP honors.
Saquon Barkley (RB): 25 carries for 57 yards. It was a quiet day by Barkley’s 2,000-yard-season standards, but Philadelphia’s passing attack and defense carried the load instead.
A.J. Brown (WR): 3 receptions for 43 yards and a touchdown. Brown’s second-quarter score extended the Eagles’ lead to 24-0 and effectively ended any competitive tension in the game.
Cooper DeJean (CB): 1 interception returned 38 yards for a touchdown. DeJean’s pick-six was the single biggest defensive play of the game and turned a 10-0 lead into a 17-0 rout in progress.
Statistical Leaders Summary Table
| Category | Kansas City Chiefs | Philadelphia Eagles |
| Leading Passer | Patrick Mahomes (257 yds) | Jalen Hurts (221 yds) |
| Leading Rusher | Patrick Mahomes (25 yds) | Saquon Barkley (57 yds) |
| Leading Receiver | Xavier Worthy (157 yds, 2 TD) | A.J. Brown (43 yds, 1 TD) |
| Defensive Playmaker | — | Cooper DeJean (Pick-Six) |
Why the Eagles Won
Defensive Line Pressure
- Philadelphia’s rebuilt defensive front generated consistent pressure on Mahomes throughout the game, forcing him off his usual spot in the pocket.
- That pressure translated directly into the turnovers that flipped field position and points in Philadelphia’s favor.
Explosive Special Teams and Defensive Scoring
- Cooper DeJean’s pick-six was a game-defining, non-offensive score that Kansas City had no answer for.
- Combined with Jake Elliott’s two made field goals, Philadelphia found points from every phase of the game, not just the offense.
Ball Control Through the Ground Game
- Philadelphia out-rushed Kansas City 135 yards to 49, controlling tempo and limiting Mahomes’ opportunities.
- Long, sustained drives (36:58 time of possession) kept the Chiefs’ offense off the field for most of regulation.
Why the Chiefs Lost
Turnovers at the Worst Possible Moments
- Three Kansas City giveaways, including a pick-six, gifted Philadelphia points and field position it didn’t have to earn.
- A defense that finally settled in during the second half couldn’t overcome the deficit created in the first thirty minutes.
Heavy Dependence on Two Players
- Outside of Xavier Worthy’s breakout day, Kansas City’s passing attack struggled to generate consistent production, with Travis Kelce managing only 39 yards.
- When Worthy wasn’t targeted, the Chiefs’ offense had few answers against Philadelphia’s coverage.
Historical Context and Advanced Insights
Season Series Breakdown
| Matchup | Date | Result |
| Super Bowl LVII | February 12, 2023 | Chiefs 38, Eagles 35 |
| Super Bowl LIX | February 9, 2025 | Eagles 40, Chiefs 22 |
This was a direct rematch of the Chiefs’ three-point win two years earlier, and Philadelphia’s blowout victory flipped the head-to-head Super Bowl record between the franchises to 1-1.
Advanced Statistical Insights
Efficiency per possession told the real story of this game more than the box score’s raw yardage did. Philadelphia’s 9.1 yards-per-pass-attempt figure, nearly two full yards better than Kansas City’s 7.1, showed how much more explosive the Eagles’ passing game was on a per-throw basis, even while attempting fewer passes overall. Meanwhile, Kansas City’s 5.6 yards-per-play average actually outpaced Philadelphia’s 4.9, underlining how turnovers and a lopsided possession count, not raw per-snap production, decided the outcome. A team can win the efficiency battle and still lose the game if it hands over three extra possessions.
Game Implications and Key Lessons
What This Means for the Eagles
- Philadelphia secures its second Super Bowl title in franchise history and validates the roster investments made in the offensive and defensive lines.
- The win avenges the Super Bowl LVII loss and positions the roster’s young defensive core for a potential multi-year run.
What This Means for the Chiefs
- Kansas City’s bid for a historic three-peat ends, and the offensive line issues exposed in this game will likely be a full offseason priority.
- Patrick Mahomes’ turnover-heavy performance stands out as an area for correction heading into next season.
Key Lessons
- Turnover margin remains the single most predictive stat in a Super Bowl-level matchup.
- Time of possession compounds over four quarters; extra offensive snaps mean extra scoring chances.
- A dominant defensive line can neutralize even elite quarterback play.
- Yards per attempt, or explosive plays, are more significant in the passing game than overall completions.
- Non-offensive touchdowns, like pick-sixes, can decide championship-level games outright.
- Depth at wide receiver matters when a top target like Travis Kelce is taken away by coverage.
FAQs
Who won the Chiefs vs Eagles Super Bowl LIX matchup?
The Philadelphia Eagles defeated the Kansas City Chiefs 40-22.
Who scored the most points individually in the game?
Xavier Worthy led all receivers with 2 touchdowns for Kansas City, while Jalen Hurts accounted for 3 total touchdowns for Philadelphia.
What were the game’s stats for Patrick Mahomes?
Mahomes finished 21-of-32 passing for 257 yards, 2 touchdowns, and 3 interceptions.
What were the game statistics for Jalen Hurts?
Hurts went 17-of-22 for 221 yards and 2 touchdowns through the air, adding 72 rushing yards and a rushing touchdown, and was named Super Bowl MVP.
Saquon Barkley ran for how many yards?
Barkley carried the ball 25 times for 57 yards, a below-average day by his 2024 season standards.
Where was Super Bowl LIX played?
The game was played at Caesars Superdome in New Orleans, Louisiana, in front of 65,719 fans.
Conclusion
The underlying stats reveal a different picture, despite the final score suggesting a contested football game: Philadelphia scored in every stage of the game, controlled the ball, and prevented turnovers. while Kansas City’s turnovers and lopsided time of possession buried its offense before it ever found rhythm. Super Bowl LIX was determined by efficiency and complementary football over individual brilliance.